American agriculture is, unless you live in the Heartland, largely ignored. There are more exciting developments to the public happening on the tech coasts than there are innovations in the farming heart of the country, but no matter which way you slice it, agriculture is still at the center of many states’ economies. I wondered about the distribution of crops across the country on countless drives through almost every region, from the Northeast to the West and it seems that Joe Satran, a staff writer for the Huffington Post, felt the same way.
Videos by Rare
The purpose behind creating this original infographic was, originally, to determine what crops make the most money for each state. As it turns out, when he began to compile data from the U.S. Department of Agriculture’s National Agricultural Statistical Service, he found “that in most states, the biggest crop was one that was used mostly for animal feed.” So without further ado, check out this map of the United States and the most lucrative food crop American farmers there produce.

For a closer look, here’s the full list and profit per year. Remember, these are only for human food crops, per the United States Department of Agriculture report, and therefore Iowa’s $4.5-million-per-year corn crop isn’t on this list.
Alabama: Peanuts, $241M
Alaska: Potatoes, $3.8M
Arizona: Lettuce, $424M
Arkansas: Rice, $136M
California: Grapes, $5.2B
Colorado: Wheat, $536M
Connecticut: Sweet corn, $11M
Delaware: Wheat, $44M
Florida: Oranges, $1.8B
Georgia: Peanuts, $960M
Hawaii: Sugarcane, $73M
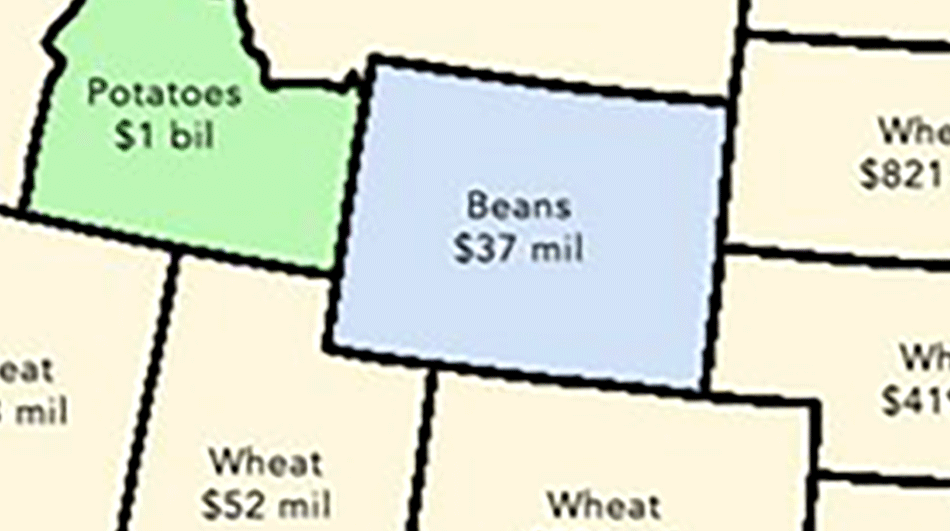
Idaho: Potatoes, $1B
Illinois: Wheat, $139M
Indiana: Wheat, $243m
Iowa: Wheat, $4.5M
Kansas: Wheat, $2.9B
Kentucky: Wheat, $201M
Louisiana: Sugarcane, $512M
Maine: Potatoes, $177M
Maryland: Wheat, $114M
Massachusetts: Cranberries, $100M
Michigan: Wheat, $322M
Minnesota: Wheat, $622M
Mississippi: Rice, $136M
Missouri: Wheat, $272M
Montana: Wheat, $1.6B
Nebraska: Wheat, $419M
Nevada: Wheat, $9.3M
New Hampshire: Apples, $7.8M
New Jersey: Blueberries, $81M
New Mexico: Pecans, $111M
New York: Apples, $250M
North Carolina: Wheat, $286M
North Dakota: Wheat, $2.7B
Ohio: Wheat, $243M
Oklahoma: Wheat, $1.2B
Oregon: Wheat, $465M
Pennsylvania: Mushrooms, $529M
Rhode Island: Sweet corn, $3.5M
South Carolina: Peanuts, $133M
South Dakota: Wheat, $821M
Tennessee: Wheat, $145M
Texas: Wheat, $643M
Utah: Wheat, $52M
Vermont: Maple syrup, $35M
Virginia: Wheat, $113M
Washington: Apples, $2.5B
West Virginia: Apples, $23M
Wisconsin: Wheat, $622M
Wyoming: Beans, $37M
Overall, there are some surprises on this list. For example, I wouldn’t have expected New Mexico to be the most lucrative U.S. agriculture source of pecans. Modern agriculture, though, still shows that wheat is the most lucrative crop for most states in the U.S. In the southern region, though we see peanuts creep into the picture. The Northeast is, by far, the most diverse region of lucrative crops, with the varied fruits and vegetables grown by U.S. farmers.
Again, this map doesn’t reflect the percentage of each state’s agricultural contribution to feed for farm animals, though Satran did create an infographic featuring the division between human food and animal feed in the United States. To learn more and check out that infographic, head on over to Huffington Post.
So the next time you’re driving through farmland for miles, consider what’s being grown around you. We all move through this country without often considering the ones on the ground breaking their backs to lift it up for economic growth.