Perhaps I spend too much time lurking around left-leaning blogs, but there are many myths taken as fact without any additional analysis.
Videos by Rare
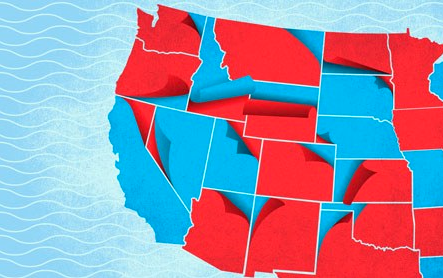
Chief among them? The notion that red states take the most aid from the government, are the poorest and are the most violent.
Mitt Romney sparked outrage during the 2012 election for his comments about the “47 percent” of Americans who are dependent on government. Romney was actually quoting the percentage of Americans who pay no federal income tax, not the percentage of people who receive government aid, which is a slightly larger 49 percent.
In an article published before Romney’s gaffe, liberal economist Paul Krugman blogged that “Aaron Carroll of Indiana University tells us that in 2010, residents of the 10 states Gallup ranks as ‘most conservative’ received 21.2 percent of their income in government transfers, while the number for the most liberal states was only 17.1 percent.”
Romney’s comments only seemed to give the left more reason to summon up statistics like these to “prove” who the real moochers are.
But as solid as the statistics Krugman provided might seem, we’re left with one glaring problem: States aren’t people. Could it be possible that liberals within conservative states are the ones taking the welfare dollars?
A survey by the Maxwell Poll on the political affiliation of those receiving government aid showed this to be the case.
| Type of Benefit Received | Percent Voting Democrat | Percent Voting Republican |
| Public Housing |
81% |
12% |
| Medicaid |
74% |
16% |
| Food Stamps |
67% |
20% |
| Unemployment Compensation |
66% |
21% |
| Disability (from Govt.) |
64% |
25% |
| Welfare/Public Assistance |
63% |
22% |
In addition to the welfare myth, we’re also told that red states are the poorest states (which would make sense if red states really were taking all the welfare dollars). PolitiFact rated such a claim as “true” noting, “The Census data also show that 9 of the 10 states with the lowest median household income were Red: Mississippi, Arkansas, West Virginia, Kentucky, Alabama, Tennessee, Louisiana, South Carolina and Oklahoma.” Whether or not a state is red or blue is based off how they voted in the 2012 election.
In another case of how sloppy PolitiFact’s “fact checking” can be, they didn’t even take cost of living differences into account when determining which states were the poorest.
Or that half of those “red” states have Democratic Governors.
When we look at the ten poorest states by median household income adjusted for cost of living differences, we find Maine, West Virginia, Hawaii, Mississippi, Arkansas, Montana, Vermont, New Mexico, New York, and Louisiana. If Washington D.C. had statehood, it would’ve ranked 5th poorest, knocking Louisiana off the top ten list. Of these ten states (not including D.C.), four voted Democratic in the past election compared to six tilting right, though there would be a perfect 50-50 split in voting patterns if D.C. was included.
Regardless, comparing the wealth of a state by how they voted in a single presidential election is a ridiculous way to measure what types of policies help and harm growth.
Lastly, we move to the argument that red states are the most violent. This argument is at least better structured than the prior myths discussed in this article.
To avoid the problems associated with comparing entire states to one another, author Sam Harris has compared cities within states. Harris writes, “Of the 25 cities with the lowest rates of violent crime, 62 percent are in blue states and 38 percent in red states. Of the twenty-five most dangerous cities, 76 percent are in red states, and 24 percent in blue states.”
A few counterpoints come to mind after reading Harris’s argument, the most obvious being that those living in cities generally have liberal voting patterns. Higher population density is known to positively correlate with more liberal voting habits. Another problem with the argument is that while these cities may be located in red states, they’re also located in blue counties.
Of the 25 most violent cities Harris mentions, only 16 percent were located in red counties, compared to 84 percent in blue counties. Lastly, recent polling on the voting habits of prison population show 61.5 percent of convicts to be Democrats compared to 9 percent Republican.
Many of these red state myths serve as effective talking points for the left, but upon closer inspection simply don’t hold up.


