The Robert Reich-narrated documentary “Inequality for All” is a much-lauded movie. It won an award when it premiered at Sundance. Critics gave Bill Clinton’s first labor secretary’s film a solid “90% fresh” rating on Rotten Tomatoes. “Inequality for All” has been praised by Business Insider, The Guardian, and PBS, among others.
Videos by Rare
So I thought I’d give it a watch. After viewing the film for myself, I have to conclude that approximately 90% of film critics must lack a basic understanding of economics. Below in bold are some of Reich’s more absurd claims, followed by necessary reality checks.
Reich claims: The richest 400 Americans have more wealth than the bottom 150 million people.
Reality: If you have no debt and some loose change in your pocket, congratulations, you have a higher net worth than the bottom 25% of American households. That’s because the bottom 25% of American households have either zero or negative net worth.
That isn’t to say that everyone in this category is impoverished, as many simply own less equity in their homes than they still owe, are paying off student loans, or a similar form of “good debt.” And this is hardly a failure of American capitalism, as even a country like Denmark which has an extremely low level of income inequality has higher levels of wealth inequality than the U.S.
Reich claims: The income share of the “top 1%” peaked in 1928 and 2007, followed by crashes.
Reality: Reich’s theory to explain this correlation is that as those at the top get richer, they begin investing in speculative assets, thereby creating a bubble which will eventually pop.
The only problem is that before we can even create a theory to explain this correlation, we have to remember that we’re only looking at two data points. Since this sort of argumentation became commonplace following the most recent financial crisis, the National Bureau of Economic Research (NBER) decided to tackle the question of the link between inequality and financial crisis. NBER found “no evidence that a rise in top income shares leads to credit booms” and instead fingered “low interest rates and economic expansions” as the two only “robust determinants” that a credit boom was happening.
In the most recent recession at least, there were artificially low interest rates after 9/11, which many argue set the stage for the housing boom and subsequent bust.
Reich claims: Consumer spending is 70% of the economy. Since the middle class and poor spend most of their income, which the rich don’t, they’re the main drivers of the economy.
Reality: A closed economy’s GDP is composed of Consumption, Investment, and Government expenditure, represented by the equation Y = C + I + G. When Mark Skousen attacked the “70%” figure in his 2007 book “The Big Three in Economics,” the variables composing the economy were as such:
C = 70%
I = 12%
G = 18%
But GDP only measures the value of the sale of final goods and services in the economy. So let’s say your job involves delivering books from a printing press to a bookstore. This transaction isn’t accounted for in GDP, while the final sale at the bookstore counter is. Because of this omission, GDP fails to accurately account for various steps in the economy. The consumer purchase of the books increases C’s role in GDP, but the business to business transaction doesn’t counterbalance C even though the books wouldn’t be sold without that step.
According to Skousen’s own, arguably more accurate measures, consumption only accounts for roughly a third of the economy, while business spending accounts for more than half of economy.
Reich claims: Wages and productivity have diverged since the late seventies.
Reality: Sure, wages alone have diverged from productivity (since the early, not late, seventies). But wages aren’t everything that makes up a person’s income. Most people get benefits as well. It’s misleading to only measure wages when the percentage of income in the form of “fringe benefits” has nearly doubled in the past 40 years. Here is a chart of productivity and total compensation, as calculated by the Heritage Foundation:
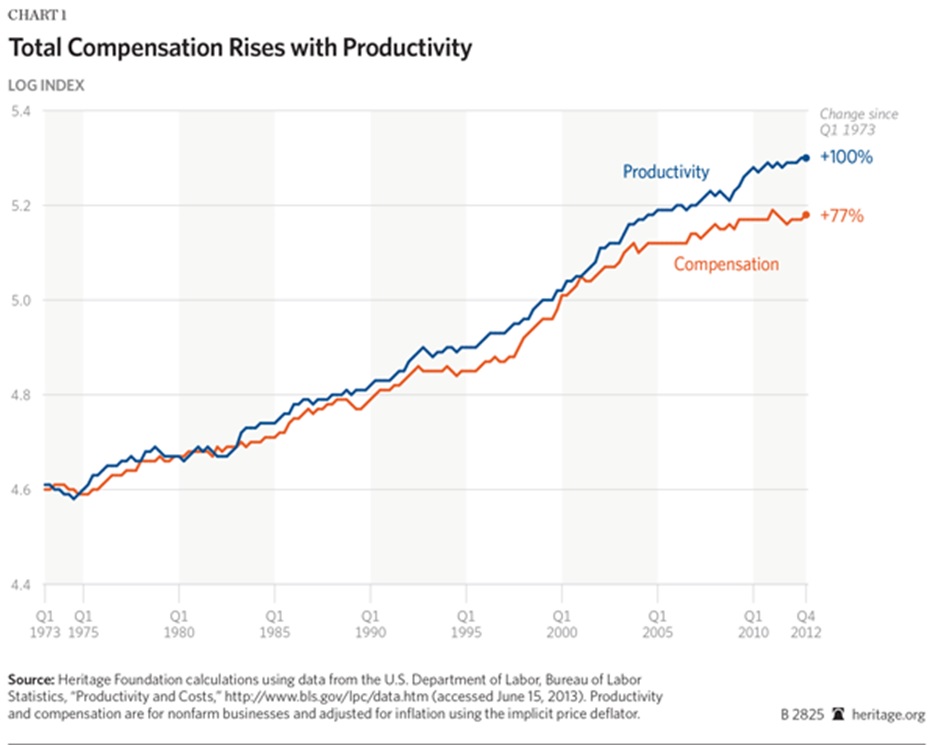
Noteworthy is that the London School is Economics has actually found a lower productivity and compensation gap than Heritage, that “productivity has grown 13% more than compensation since 1972 in the US.”
The reason that total compensation has been increasing, but wages have stagnated has to do mainly with healthcare costs. As the cost of providing healthcare benefits to employees increases, this comes at the expense of wages.
Reich claims: Decline in labor unionism corresponds with decline in middle class income share.
Reality: The middle class is shrinking because people who were formally defined as “middle class” have moved up to higher income levels.
Reich claims: The inflation adjusted cost of housing has risen from $15,579 in 1970 to $21,684 in 2010.
Reality: The average home size increased from 1,400 square feet in 1970 to 2,700 square feet in 2009. Average home size nearly doubled, but spending on housing increased only 39%, which is hardly a bad deal. Regardless, no one is forcing anyone to live in a larger home.
Reich claims: Children born into poverty in the U.S. have a lower chance of rising into the middle class as compared to other first world nations.
Reality: In the USA, 42% born into the bottom 20% remain in that quintile. That is low relative to other developed nations. However, we define our income quintiles differently than other nations. In the U.S., for someone to move from the bottom 20% to the middle quintile, they’d have to earn an additional $22,000, but in Sweden someone would only have to earn an additional $12,500 to pull the same feat.
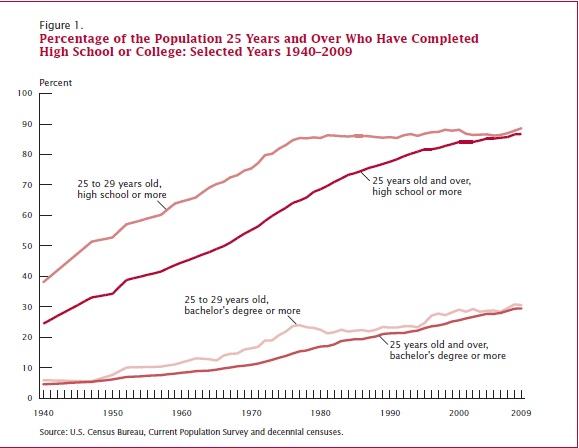
Reich claims: Inequality is increasing because the percentage of college educated Americans has flat lined since the late 70s.
Reality: Below is a chart from a Census Bureau report on educational attainment in the U.S. The line at the bottom shows the percentage of the population aged 25 and older who have at least a bachelor’s degree. I can’t say that I see any flat lining.
Reich claims: American CEOs earn over 350 times the average worker.
Reality: I’ve covered this in depth in another column. This statistic is measuring CEO pay in the nation’s largest companies and comparing that to the average worker’s pay. In the film, Reich neglects this fact which makes it seem like every CEO out earns the average worker 350 to 1. I thought that Reich ought to know better – and it turns out he does.
Tucked into a blog post at UC Berkeley, where Reich advocates taxing CEO pay of course, he acknowledges that the 350:1 statistic is only true among big corporations. In other words, Reich decided to be truthful in a blog post which tens of people will read, but opted to be deceptive in a documentary which millions will view.