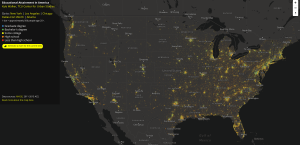
Last month, an interactive map, based on information from the National Historic Geographic Information System, in affiliation with the TCU Center for Urban Studies, showing education levels across the U.S. was posted to GitHub, a public project hosting forum for open-source code.
Videos by Rare
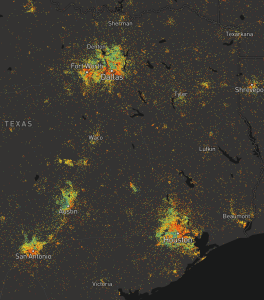
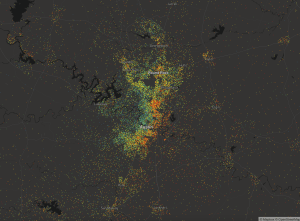
One dot equals approximately 25 people ages 25 and older, and the educational data is broken down by color:

Texas and Houston are both colorful across the spectrum:
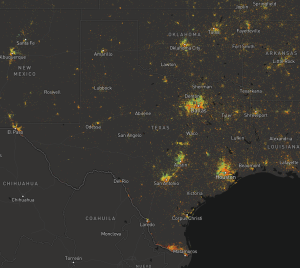
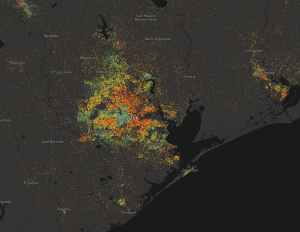
But there are some notable divides, naturally of corporate and chemical, in the Bayou City:
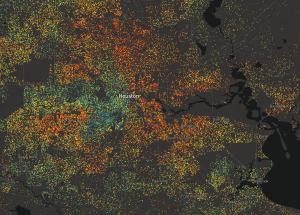
The concentration of highest education, a graduate degree blue dot, is on the West side of town, with a second cluster in Clear Lake, home to NASA’s Mission Control.
However, nearly all of the areas surrounding the large refineries and other industrial plants are colored orange and red, indicating residents have high school or less than an equivalent degree.

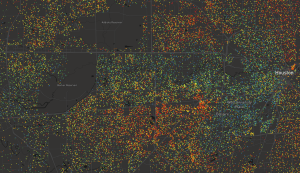
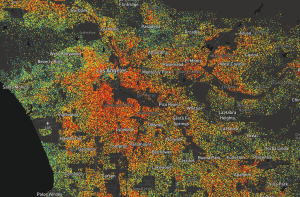
Austin has its own unique spectrum, with a natural concentration of high, graduate degree education on the West side surrounding the University of Texas’ main campus.
And the DFW area is somehow becoming larger than Houston.
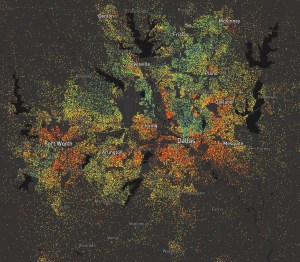
Maybe even smarter.
In Texas and across the nation, education levels are correlate with more expensive real estate and locations to live, with the exception of one place, where the predominant industry is getting paid to pretend:
The real education from this map is that it’s all about who you know.
Explore the rest of the nation’s education status’ and read about the Python program behind this colorful display here.